Dashboards offer key insights into KPIs (Key Performance Indicators) of various Supply Chain facets. Currently, there are 11 standard dashboards available on InSync Cloud
- Management Overview
- Fulfillment Overview
- Inventory Overview
- Production Overview
- Capacity Overview
- Sourcing Overview
- Distribution Overview
- Messages Overview
- Root Cause Overview
- Alerts
- Status Overview
- Plan Regression KPIS
The data in dashboards are visualised through a combination of grids,charts, pie charts, heat charts etc. A sample dashboard is shown below
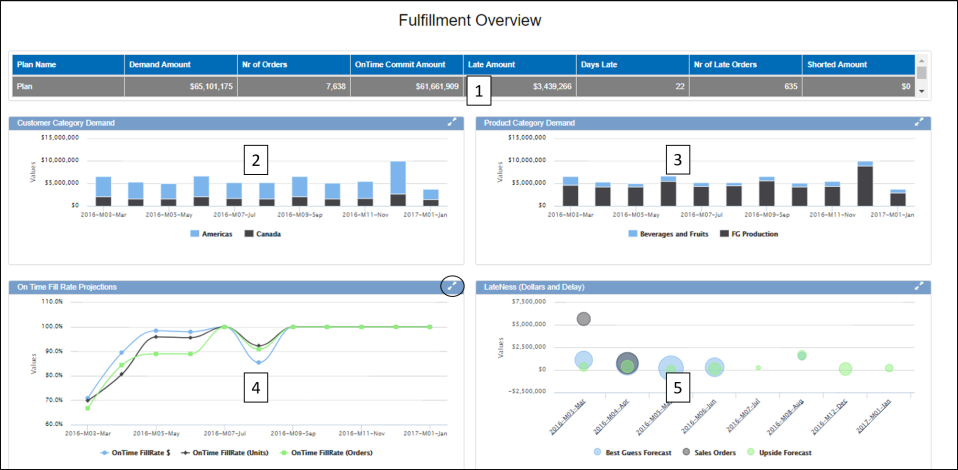
In the above example of a Fulfillment Dashboard, there are two components. 2,3,4 & 5 are different types of charts that show data based on the selection in component 1.
Clicking on the double arrow button expands any component to full screen
Dashboard Navigation
It is common for most dashboards to have a grid at the top with a high level data summary that drives the other components to show the relevant data.
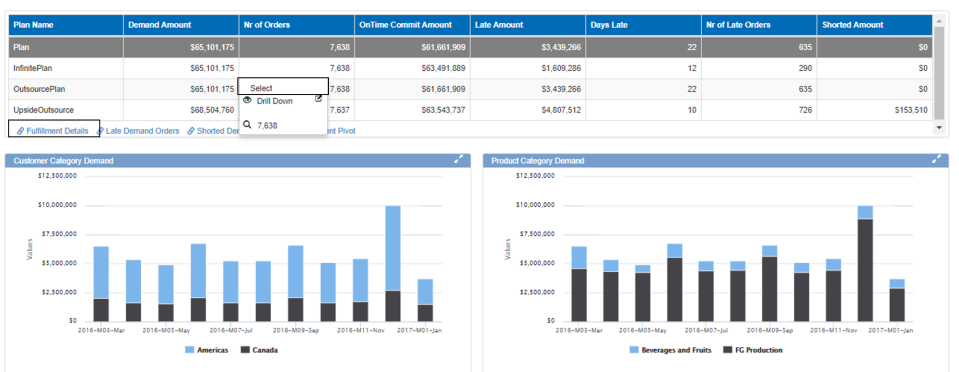
Clicking on any row and selecting the row will refresh the data components below to show the relevant information
For some grids, there are also links to other workbench that are relevant to this data. In the below example, from the fulfillment dashboard there are links to open Fulfillment details, late orders and shorted orders. These links can be found just below the grid with the link icon.
Dashboard Settings
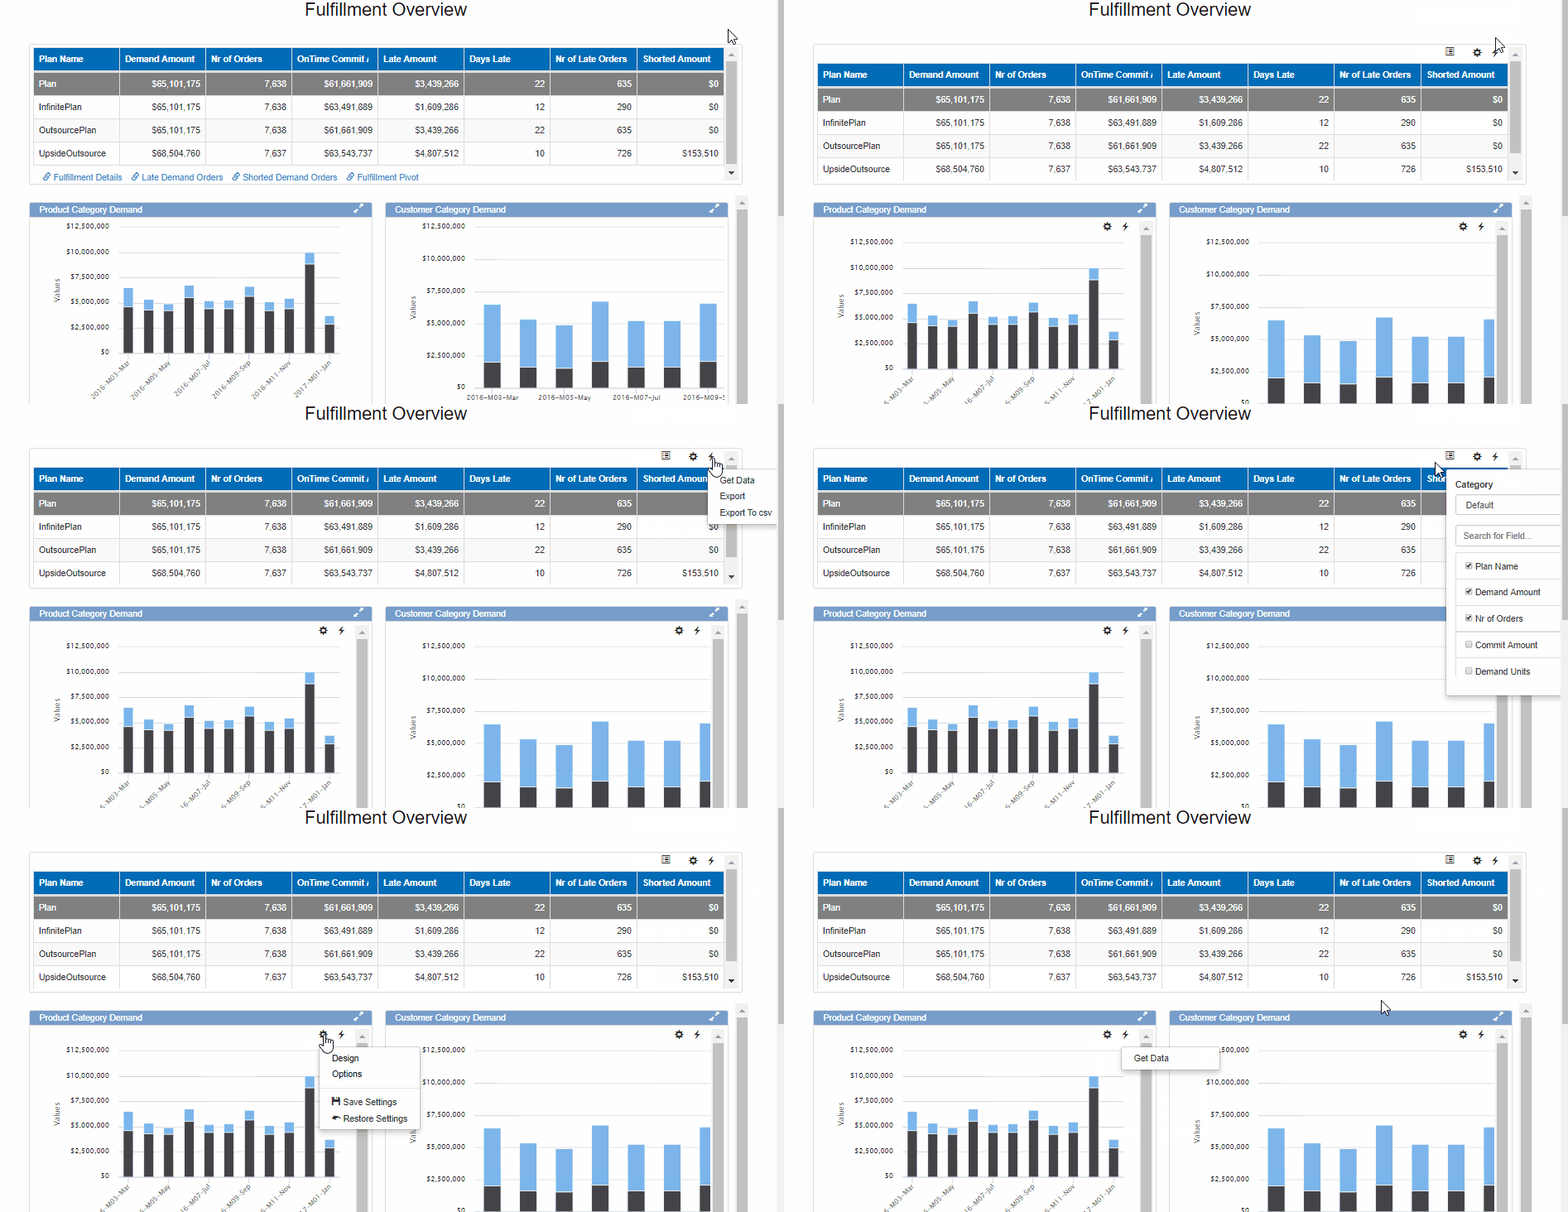
The dashboard settings are accessed through the wheel icon at the top right corner which is only visible on mouse hover.

Click on the wheel icon to navigate to different controls of the dashboard
- Get Data – Refreshes the data in the dashboard
- Show Configurations – Brings up the configuration options for all the components of the dashboard
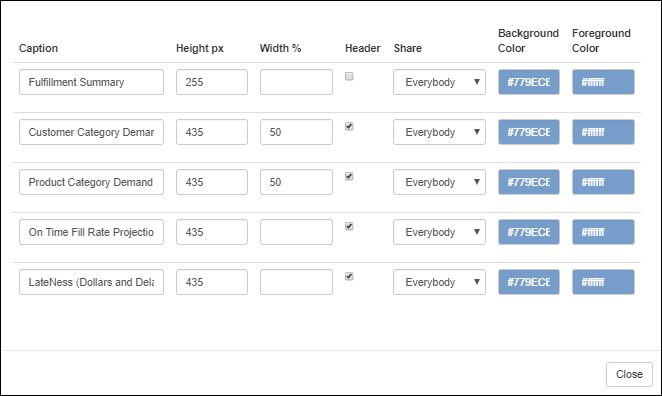
- Edit – This allows to control the caption, height, width , color settings and security of the dashboard components
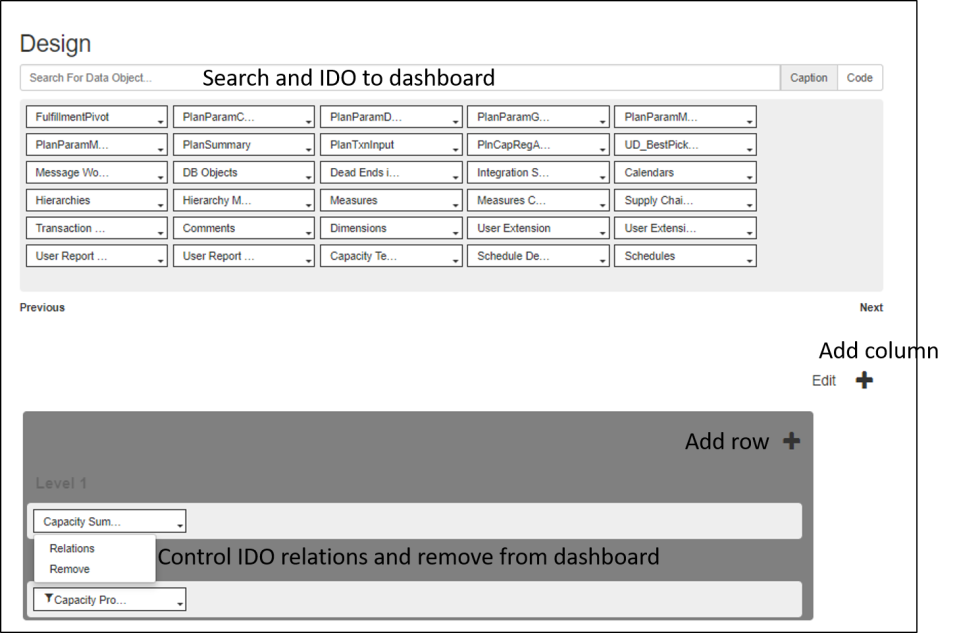
- Design – In design, the layout of the dashboard can be configured as well as add more components to the dashboard(Admin users only)
- Search and add IDO to dashboard through the search box at the top
- Click on the “+” button to add column dashboard and within the dashboard click on the “+” button to add more rows(seen in picture below)
- Click on the Edit button to set default height and delete components
- Click on existing IDO within dashboard to add relations or remove it from dashboard
- Save Layout – Saves any layout changes made to dashboard
- Save settings – Saves any setting changes made to dashboard
- Clear layout – Clears any recent changes made to dashboard to revert to original layout
Show Configurations
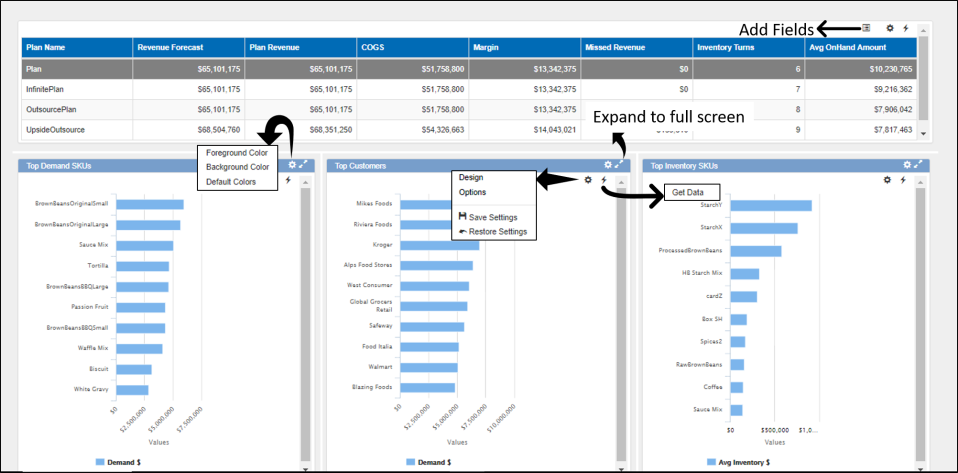
After clicking on the show configurations, the configuration options for each component within the dashboard are visible. The following can be controlled through these
- Color settings
- Adding fields
- Settings/Options for grid/charts
- Refresh data
- Export for grids
- Expand component to full screen
Pingback: Release Notes v4.1811 | InSync