Category Archives: Uncategorized

qPivot

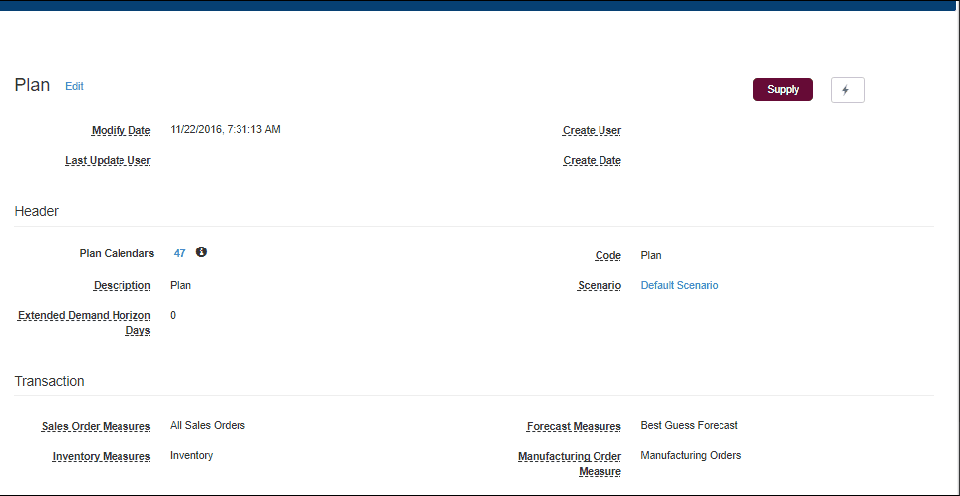
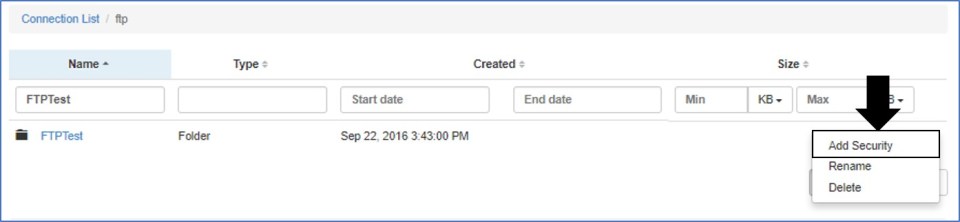
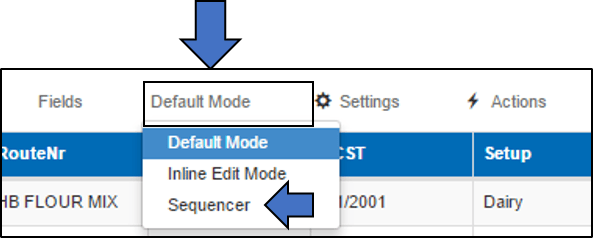
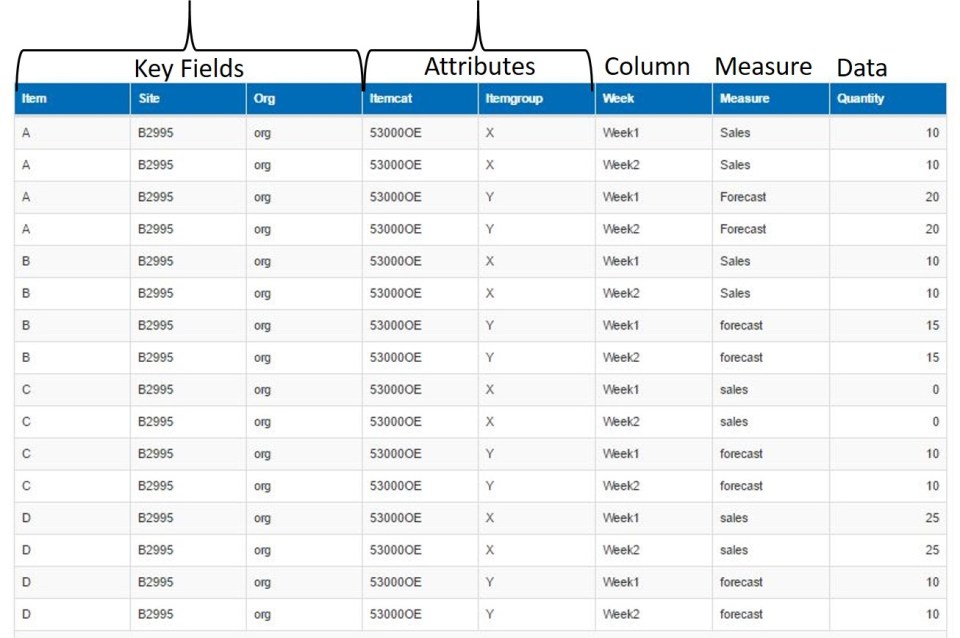
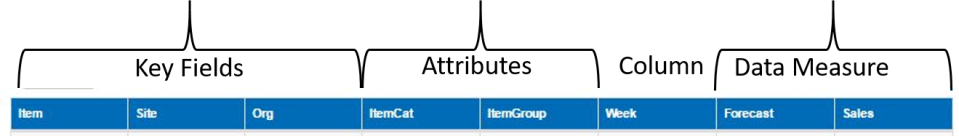
A new component called the qPivot is now available in the latest release. qPivot offers a lot of flexibility to the user in data visualisation. The main features are

  • Summarize Data in pivot and graph mode
  • Data Filters
  • Edit mode in graphs and pivot

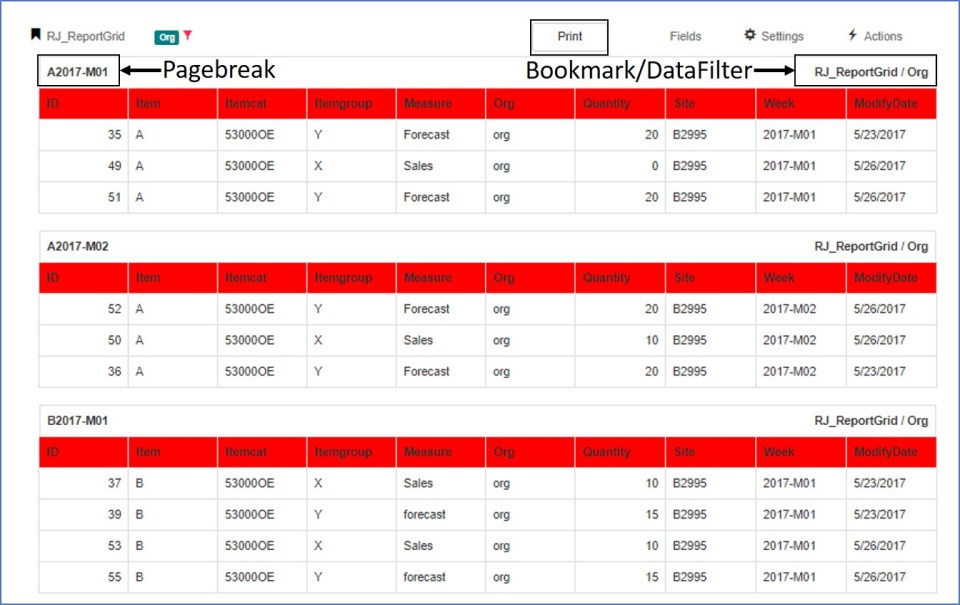
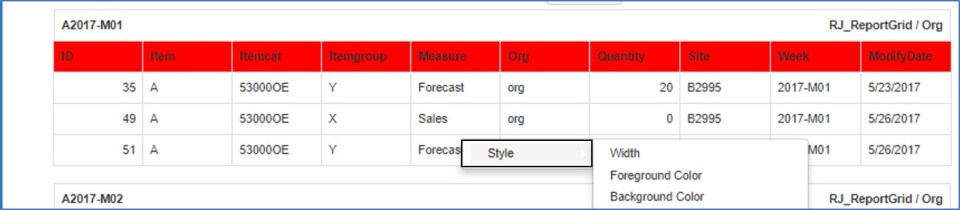
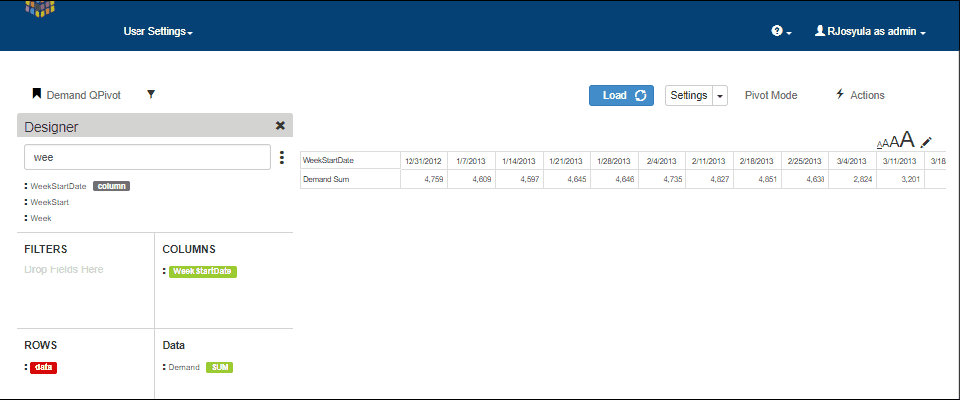
The picture below is a screenshot of qPivot displaying the various elements in it.

qPivot

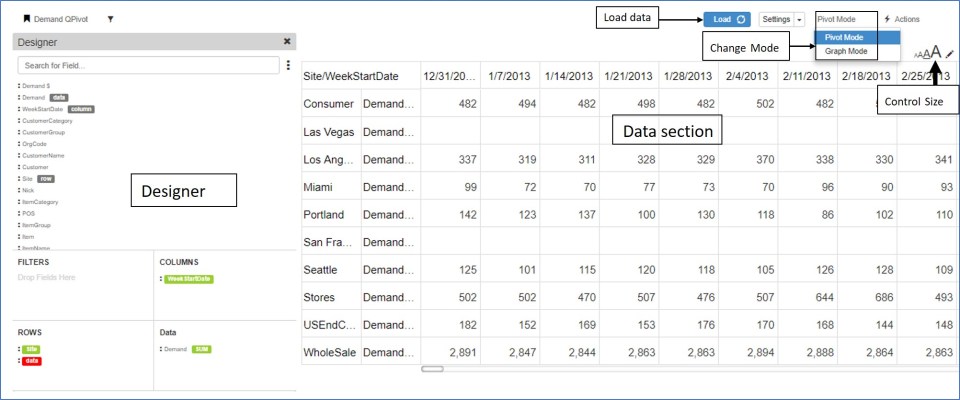
  • The qPivot has the Designer to the left with data displayed on the right side.
  • The load button loads/refreshes data after the fields are selected
  • Toggle between Pivot/Graph mode
  • Change the size of the pivot through the size control option

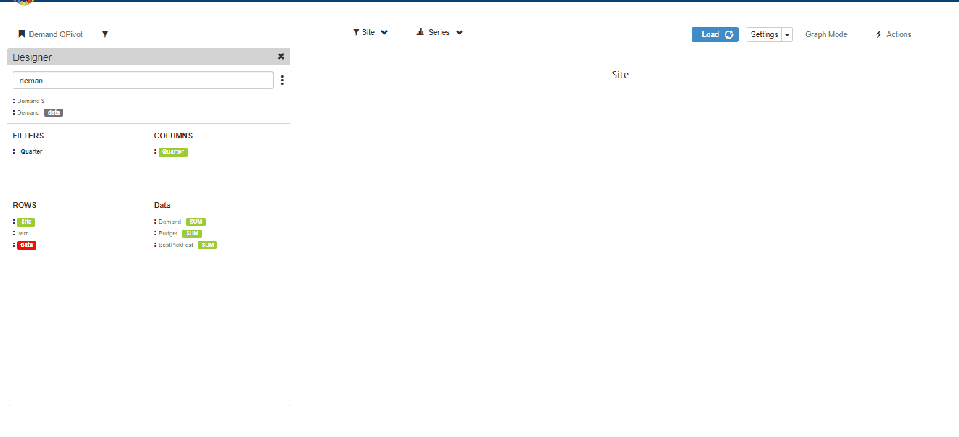
1) Designer – qPivot

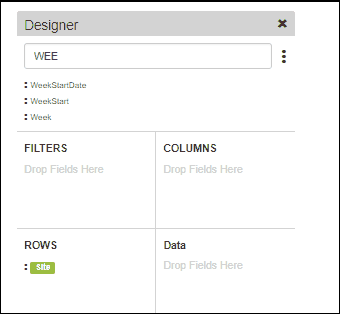
The designer section contains the following

  • All fields available for this pivot
  • Search – search for any existing field
  • Filter area – Filters applied on any field are displayed here
  • Rows – fields which are to be in the row section of pivot
  • Columns  – fields which are to be displayed in the column section of pivot
  • Data  – fields which are to be displayed as data in the pivot

There are two ways of moving the field to the corresponding pivot section

  • Click on the three dots beside the field and select from the available row/column/filter/data option
  • Drag the field to the corresponding section

Designer add field

Designer (1)

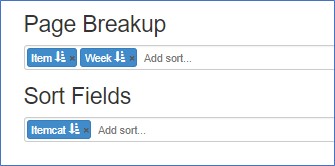
  • In any section the order of the fields can be changed by draging and dropping them at the required position.
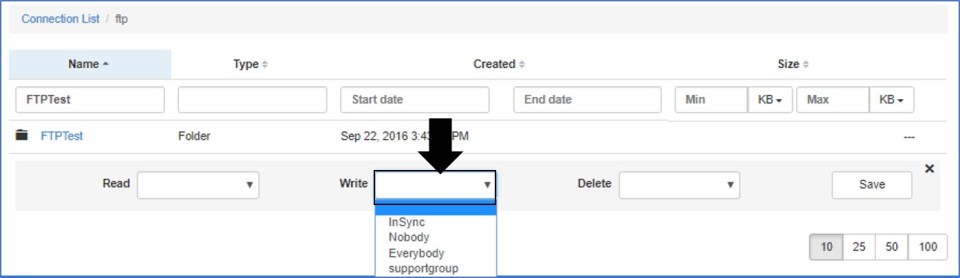
  • Dragging a field to the filter area brings up the filter pop up where users can apply the filter
  • Data fields have further option to select how the data is summarized. ex: count, sum etc.  Multiple summary options can be selected and viewed in the same pivot.
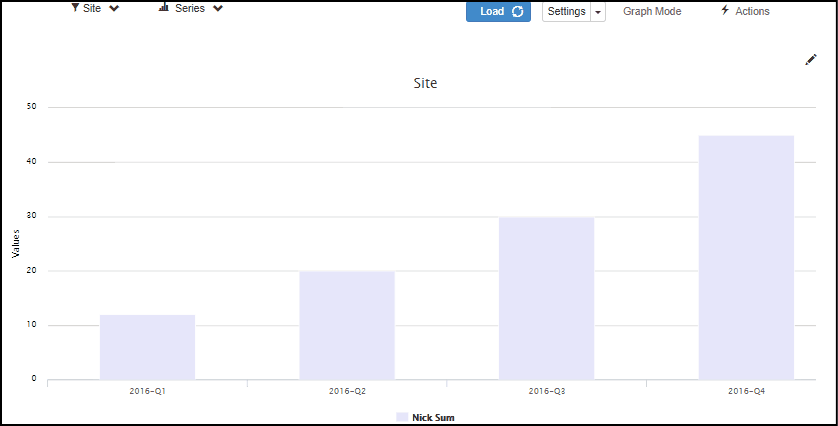
qpivot demand

Graph Mode

To illustrate how the graph mode works in qPivot, we use the following example

Row fields: Site, Item

Data : Demand, Budget, BestPickFcst

Column: Quarter(Filtered to show only 2016 Quarters

  1. In the graph mode, the data is initially shown aggregated i.e Aggregated to all the sites for each data measure selected
  2. Users can select/deselect the sites as well as series measures to see them in the graph. The data are updated immediately upon selection
  3. The graph can be viewed in stack or compare mode.
  4. Clicking on any bar opens a Pie chart displaying the data at Item level.
  5. Data can be further drill down-ed to display the graph at item level for the selected quarter
  6. Users can also select Item from the row section and directly view the graph at item level
  7. The video below shows a small sample of using the graph mode in qPivot
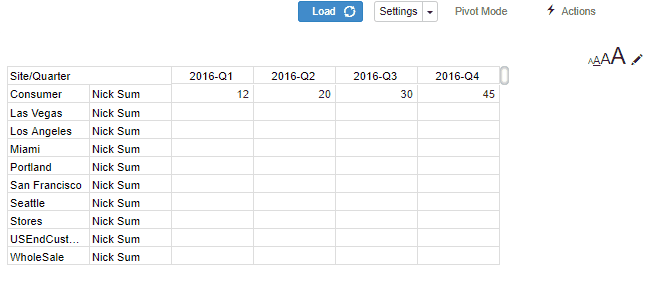
qPivot Graph Mode.gif

Pivot Mode

The same example is used for illustrating the qPivot in pivot mode

  1. In the pivot mode, all the data is shown. i.e for all sites and data measures
  2. Click on any site to drilldown to the item level data
  3. If there is any other row field below item, then the user can further drilldown by clicking on any item to see the breakuP

qPivot Graph Mode

Editing in qPivot

Edit option is available in both pivot mode as well as graph mode in qPivot

Pivot Editing

  • Click on the pencil icon to activate the edit mode
  • The editable cells change to boxes in which values can be entered
  • Click on discard to undo the entered values
  • Click on save to save the values

QPivot Pivot-Edit.gif

Graph Editing

  • Click on the pencil icon to activate edit mode
  • For any bar, drag the bar to the desired value position in the graph
  • Click on save to save the changes
  • Click on discard to undo the changes before save

QPivot Graph Mode-Edit

QPivot Settings

Click on the settings button in pivot or graph mode to change the following settings.

For Pivot Mode: Change appearance of row totals, column totals, style, stripe and colors of the pivot

For Graph Mode: Add additional axis, switch between horizontal/vertical axies, edit captions and colors as well as change the type of graph between line, sp line and bar graphs

Plan Definition & Plan Calendars

Two significant improvements have been made to Plan Management

  • Access and edit plan definition
  • Add new plan calendars

Plan Definition

From the Plan Management screen, click on any plan definition to navigate to its page

In the Plan Definition screen, users can edit and make changes and save them

Plan Definition

Add Plan Calendars

From the plan definition screen, users can add plan calendars

  • Click on the action button in the plan definition screen
  • Select the Plan Start Date and bucket size
  • Enter the number of calendars to be defined and select the transaction measures
  • Click on add to create and add the plan calendars

Add Plan Calendars

Report Grid

The Report Grid is a new component to help export data  in PDF format.

A sample Report Grid is displayed below where the data appears in a format that is conducive for printing in pdf format.

Report Grid

  • The bookmark/filter information is displayed on each page.
  • The data can be split through predefined page breaks. In the above example Item-Week is used as a page break.
  • Data is sorted through fields defined in sort fields.

Report Grid design

Options

From the options page, users can control the following

  • Toggle between portrait and landscape mode for pdf print
  • Control page and table size
  • Change Border and Font

Style

  • The grid style can be changed by clicking on any column header
  • Background & Foreground color along with column widths can be adjusted

Report Grid Style

Forget Password

Users can reset their password using the Forget Password option available on the login page

  • On the login page, click on the forget password link

Forget Password

  • In the next screen, enter the user name, email and the user organization

Forget Password screen

  • The email-id has to be the same with which the user registered
  • The user then gets a link to his registered email-id to reset his password
  • The link is only valid for the specific user and can only be used within the next 24 hours
  • Enter username, user organization and the new password to reset the password

Reset Password

Plan Management

This documents explains the new Plan Management screen and how to add/copy/delete plans
In the Plan Management screen, one can see both Supply and Demand plans and switch between them by selecting the desired one. The selected is shown with the red tick mark

Select/Deselect plans

When there are multiple plans, the plans that are visible can be changed by clicking on the red tick to display all plans. From this screen, we can add or remove plans that are visible

Sections

Each Plan Information is divided into relevant sections as shown below for supply and demand plans

Edititing

  • To Edit any plan information or create new plans, click on the edit button to the right.
  • This opens the Edit bar for each plan where users can edit/copy/delete a plan.
  • A new plan can also be created from the New Plan Button

    The three Edit Options are
  • Edit Plan:
  • Copy Plan
  • Delete Plan

Edit Existing Plan

Once we click on the Edit Button, the plan is now in edit mode where users can change the values for the parameters.

  • The edit type for fields is generally a dropdown, text edit, numeric edit or a date edit.
  • Some parameters which are dependent on other parameters value are only available for edit when the main parameter has the required value to enable editing for the dependent field as shown below

Copy Plan

Under Edit Mode, copy plan will copy an existing plan as a new plan. The new plan can only be saved once the “CD” value has been modified as it is the unique key

Delete Plan

In Edit Mode, click on the delete button to delete a plan. A confirmation pop up will ask to confirm the plan deletion.

New Plan

Under Edit Mode, click the new plan button to create a brand new plan. The new plan will have some default parameter values that can be edited.
New Plan.gif

FTP Security

Folders within the FTP structure can now be assigned security groups to control read/write/delete access to the folders.

To define the security access

  • Click on the three dots for any folder within FTP folders and click add security

FTP Add security

  • Each folder can have read security, write security and delete security
  1. Read: Only those who are part of the security group assigned will be able to view the folder and its contents
  2. Write: Only those who are part of the security group assigned will be able to add files/folders to the folder
  3. Delete: Only those who are part of the security group assigned will be able to delete the folder or its contents
  • Select from the dropdown the security groups for read, write and delete

FTP Add access

  • Once the security groups are selected, click on save

FTP Save

  • Folders which have security defined are represented by a red lock icon. Clicking the icon will display the existing security privileges

FTP Red lock

  • All sub folders and files are granted the same security privileges as its parent.

Scheduling UI – Sequencer

The Scheduling UI has sequencer functionality where users can change the sequence of operations through drag and drop functionality.

The below section explains how to use the sequencer.

  • In the relevant grid where sequencer is applicable, change to sequencer mode by clicking on the default mode buttonSequencer Mode
  • Once the sequencer mode is activated, drag and drop the desired rows to the new sequence positionsScheduling UI Sequencer
  • Click apply to see the new sequence order

Sequencer logic

When rearranging rows through drag and drop, the relative positions of the rows are remembered before making changes.

The new rows are assigned the sequence based on their positions in the grid.

This ensures that the correct sequence is assigned even if the grid has filtered data or is sorted in descending order. A few examples are shown below

Grid sorted in descending order of sequence

Descending Sequencer

Grid sorted in a random order

random Sequencer

As seen from the above gif, the sequence numbers before and after remain the same while the order numbers are now in different relative positions.

Scheduler UI – Gantt chart

The Scheduling UI is a Gantt chart with options to edit and re-arrange operations and save changes.

The following functions are available within the scheduling UI

  1. Filter: Based on Category, Group or resource
  2. Series: Change labels of operations to see relevant information. Ex: attribute/route number, ERP status etc
  3. Group by: Group resources based on Resource Category or Resource Group
  4. Modes: Toggle between Scheduler Mode, default mode or preview mode
  5. Date Filter

Scheduling UI

1) Filter data

  • Click on the Resources button to open the filter area.
  • Search and select the relevant category, group or resource
  • Click on close to apply filters.

Filter S UI

2) Change Series

  • Click on the series button to change the label information displayed on operation.
  • Click on any button to instantly see the new label

Series S UI

3) Group By

  •  Click on the settings icon
  • Toggle between group by Resource Category or Resource Group
  • Click close to apply changes

Group By S UI

4) Modes

In the scheduler mode, users can drag and drop operations and save changes.

  • Click on the default mode button
  • Select scheduler mode
  • Drag and drop any operation to the desired start time
  • Click save
  • In the edit manager, unselect if the changes are not desired.
  • Click confirm will apply the changes.
  • The screen remains in scheduler mode. Click on cancel to go back to default mode


In the preview mode, users can open drilldowns in preview mode by clicking on the operation. Any related drilldown will appear in the preview screen

5) Date Filter

To filter data based on dates follow the steps below

  • Click on the date range button
  • Select the start date and end date and click on apply

Date Filter S

Configuration Screen updates

Configuration table screens now allow better control over visibility and order of fields displayed in the respective tables.

These features are available in all applicable screens under configurations(Data Tables, IDO, Workbench, TableMaster etc)

Re-arrange fields

Drag and Drop

  • To rearrange the fields, drag the field and drop it at the desired position
  • After rearranging the fields, the order is remembered for the user for revisits to the same screen

Hide/Show Fields

  • Click on the three dots to display all the available fields
  • Select/deselect to control which fields are displayed in the UI

Hide Show

IDM Sequencer

In IDO, IDM fields can now be sequenced using drag and drop feature to control their order in the IDM table

IDM Sequencer

  • Click on the settings button and click on change order to drag and drop the desired field to their new position and click apply.

Search/Filter

In the configurations tables, there is a provision to search and filter results.

Depending on the field, either a text search or selective dropdown is available. For boolean fields a boolean filter is applicable.

IDO Filters

Pivot/Unpivot data through Bulk Export/Import

Bulk Export and Import job now has additional abilities to transform the data being importted/exported by making use of pivot and unpivot transformations.

This document explains how to set up the jobs as well as explain the csv file data structures that can now be imported into iPlanner.

Pivot & Import Data

Data in a csv file can be imported to iPlanner using the Bulk Import job. This data can be transformed using the pivot transform parameter to decide the final layout of the data in iPlanner.

The following csv file is used as an example to explain the process.

CSV1

This above data in a csv file format can be imported to iPlanner by transforming the data in two ways

Case 1) The weeks are under a single column along with measure with Quantity column displaying the respective values for each measure.

DT

To achieve this the following steps have to be followed

1) Create a Job task of type = BulkDataImport

2) Enter the following parameters for the task. These paremeters help understand the data structure and what transform needs to be done on the data

  • Table: Enter the Data table name to which the csv file has to be imported. Ex: BMD_Article
  • Keys: Enter the fields which are key in the table. If there are multiple key fields use comma to separate them Ex: Item,Site,Org
  • Column: Enter the column field in the data table. This is generally a time related field Ex: Week
  • Measure: Enter the measure field name. Ex: Measure
  • Data: Enter the data field from the data table that will store the quantity values. Ex: Quantity
  • Attributes: Enter the fields which are attributes. Ex: ItemCategory, ItemGroup. Use comma to separate multiple fields
  • Transform: For Importing data, the transform type has to be Pivot.

3) Upload the csv file when prompted during the task run

If the job task is scheduled, additional parameters are needed to specify the source file path. If the file is on the ftp server, then the ftp path and file name have to be specified.

Once the task is complete, the imported data will appear as shown below in the data table

Data Table

Case 2) The weeks are under a single column and each measure i.e Sales and Forecast are two different columns

DT2-

To achieve this the following steps have to be followed

1) Create a Job task of type = BulkDataImport

2) Enter the following parameters for the task. These parameters help understand the data structure and what transform needs to be done

  • Table: Enter the Data table name to which the csv file has to be imported. Ex: BMD_Article
  • Keys: Enter the fields which are key in the data table. If there are multiple key fields use comma to separate them Ex: Item,Site,Org
  • Column: Enter the column field in the data table. This is generally a time related field Ex: Week
  • Measure: Enter the measure field name. Ex: Measure
  • Data Measure: Enter the data measure fields from the data table that will store the quantity values. Ex: Sales,Forecast
  • Attributes: Enter the fields which are attributes. Ex: ItemCategory, ItemGroup. Use comma to separate multiple fields
  • Transform: For Importing data, the transform type has to be Pivot.

3) Upload the csv file when prompted during the task run

If the job task is scheduled, additional parameters are needed to specify the source file path. If the file is on the ftp server, then the ftp path and file name have to be specified.

Once the task is complete, the imported data will appear as shown below in the data table

Import2

UnPivot & Export Data

Data in a Table can be exported into a csv file using the Bulk Export job. This data can be transformed using the pivot transform parameter to export the data in the required format.

The data in a table can be in two different formats .

Case 1) The weeks are under a single column along with measure with Quantity column displaying the respective values for each measure.

Data Table

To Export this data follow these steps

1) Create a Job task of type = BulkDataExport

2) Enter the following parameters for the task. These parameters help understand the data structure and what transform needs to be done on the data during export

  • Table: Enter the Data table name from which the csv file has to be exported. Ex: BMD_Article
  • Keys: Enter the fields which are key for the data table. If there are multiple key fields use comma to separate them Ex: Item,Site,Org
  • Column: Enter the column field for the data table. This is generally a time related field Ex: Week
  • Measure: Enter the measure field name. Ex: Measure
  • Data: Enter the data field in the data table that stores the quantity values. Ex: Quantity
  • Attributes: Enter the fields which are attributes. Ex: ItemCategory, ItemGroup. Use comma to separate multiple fields
  • Transform: For exporting data, the transform type has to be UnPivot.

If the job task is scheduled, additional parameters are needed to specify the destination file path. If the file is to be stored on the ftp server, then the ftp path and file name have to be specified.

Once the task is complete, the exported data will appear as shown below in the sample csv file.

CSV1

Case 2) The weeks are under a single column along with measure with Quantity column displaying the respective values for each measure.

Import2

To Export this data follow these steps

1) Create a Job task of type = BulkDataExport

2) Enter the following parameters for the task. These parameters help understand the data structure and what transform needs to be done

  • Table: Enter the Data table name from which the csv file has to be exported. Ex: BMD_Article
  • Keys: Enter the fields which are key for the data table. If there are multiple key fields use comma to separate them Ex: Item,Site,Org
  • Column: Enter the column field in the data table. This is generally a time related field Ex: Week
  • Measure: Enter the measure field name. Ex: Measure
  • Data Measure: Enter the data measure fields in the data table that stores the data measure quantities. Ex: Sales,Forecast
  • Attributes: Enter the fields which are attributes. Ex: ItemCategory, ItemGroup. Use comma to separate multiple fields
  • Transform: For exporting data, the transform type has to be UnPivot.

If the job task is scheduled, additional parameters are needed to specify the destination file path. If the file is to be stored on the ftp server, then the ftp path and file name have to be specified.

Once the task is complete, the exported data will appear as shown below in the sample csv file.

CSV1