Bulk Export and Import job now has additional abilities to transform the data being importted/exported by making use of pivot and unpivot transformations.
This document explains how to set up the jobs as well as explain the csv file data structures that can now be imported into iPlanner.
Pivot & Import Data
Data in a csv file can be imported to iPlanner using the Bulk Import job. This data can be transformed using the pivot transform parameter to decide the final layout of the data in iPlanner.
The following csv file is used as an example to explain the process.
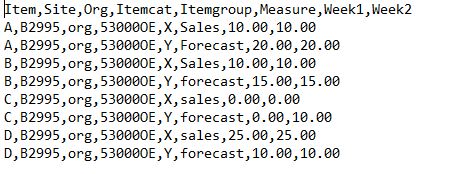
This above data in a csv file format can be imported to iPlanner by transforming the data in two ways
Case 1) The weeks are under a single column along with measure with Quantity column displaying the respective values for each measure.
To achieve this the following steps have to be followed
1) Create a Job task of type = BulkDataImport
2) Enter the following parameters for the task. These paremeters help understand the data structure and what transform needs to be done on the data
- Table: Enter the Data table name to which the csv file has to be imported. Ex: BMD_Article
- Keys: Enter the fields which are key in the table. If there are multiple key fields use comma to separate them Ex: Item,Site,Org
- Column: Enter the column field in the data table. This is generally a time related field Ex: Week
- Measure: Enter the measure field name. Ex: Measure
- Data: Enter the data field from the data table that will store the quantity values. Ex: Quantity
- Attributes: Enter the fields which are attributes. Ex: ItemCategory, ItemGroup. Use comma to separate multiple fields
- Transform: For Importing data, the transform type has to be Pivot.
3) Upload the csv file when prompted during the task run
If the job task is scheduled, additional parameters are needed to specify the source file path. If the file is on the ftp server, then the ftp path and file name have to be specified.
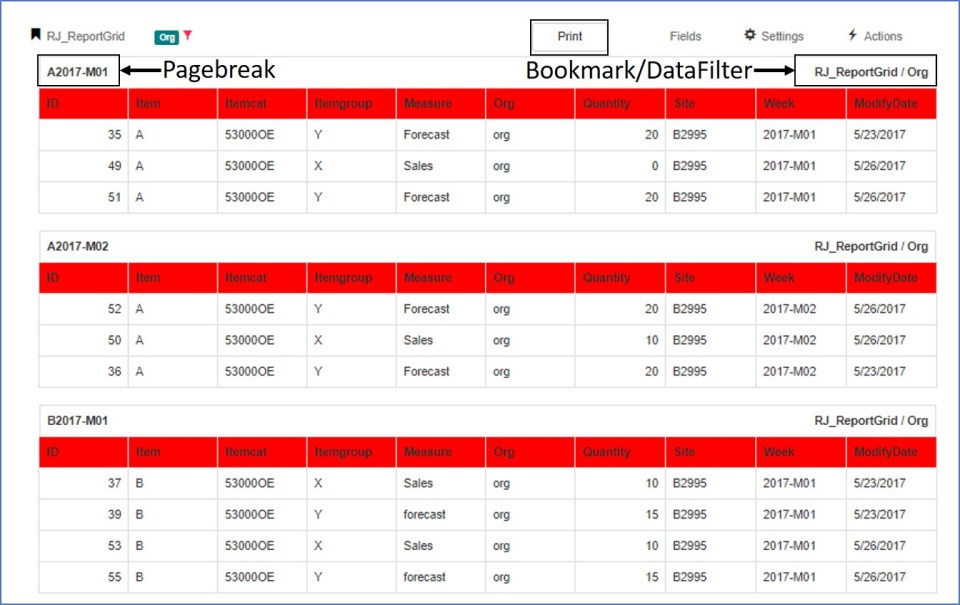
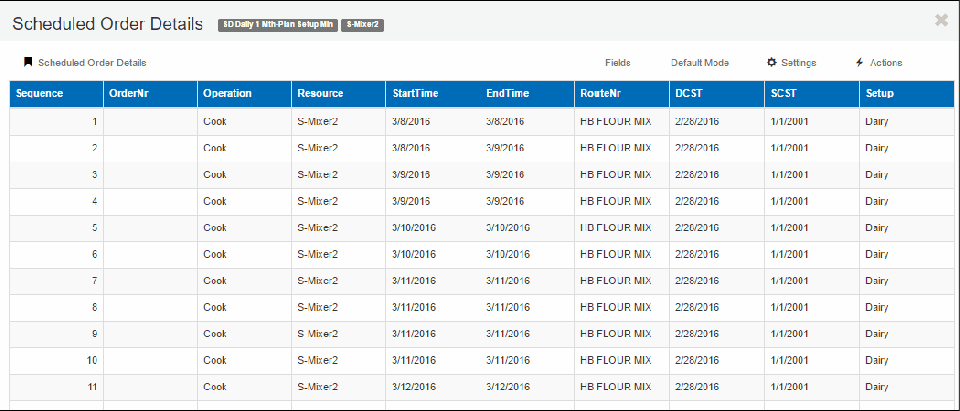
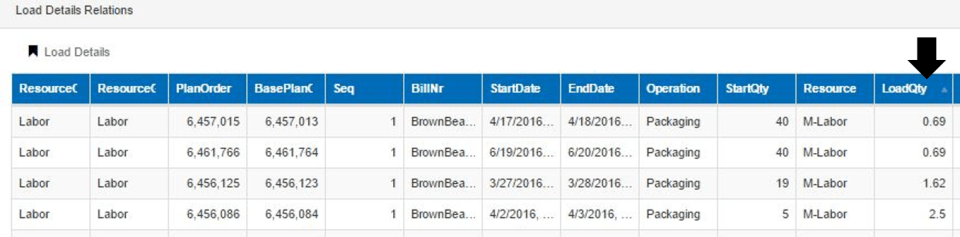
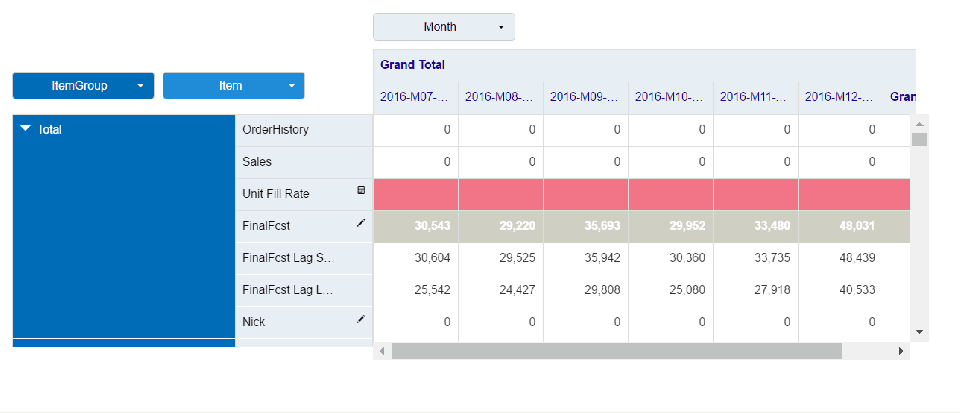
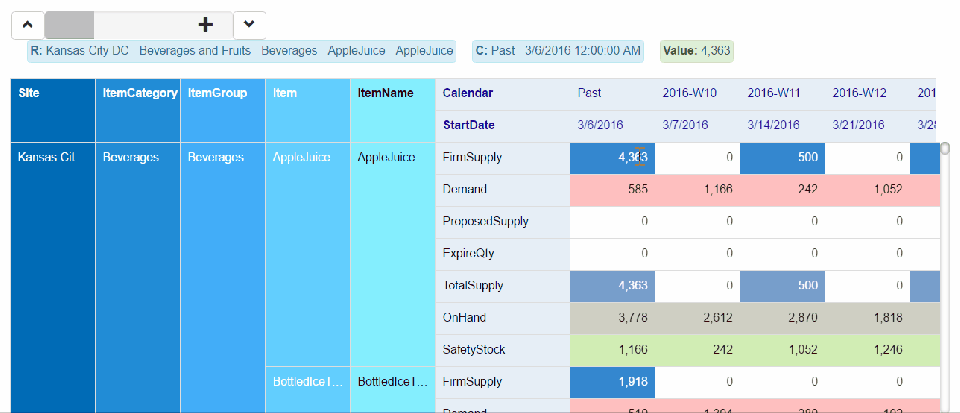
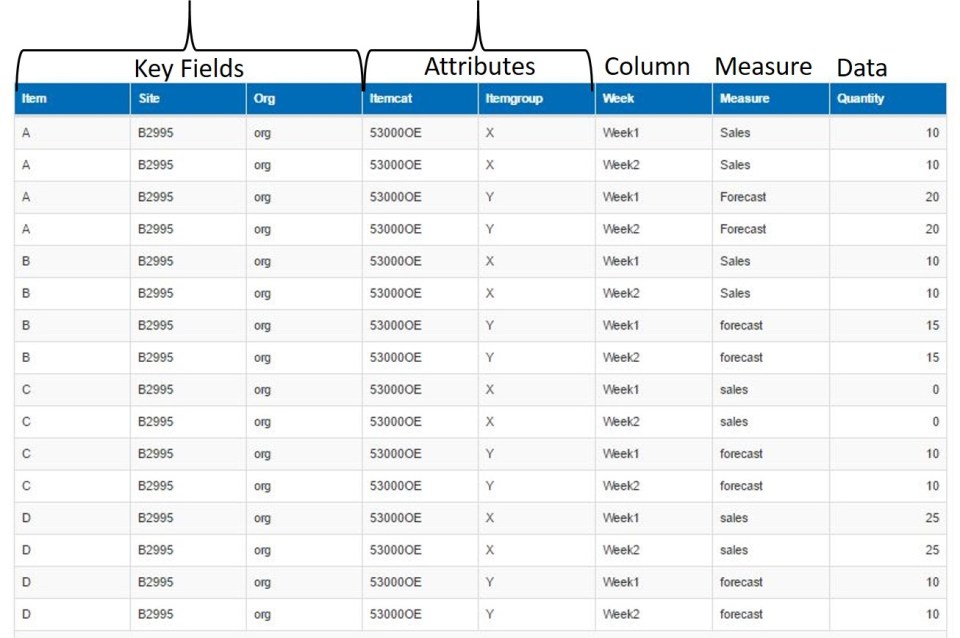
Once the task is complete, the imported data will appear as shown below in the data table
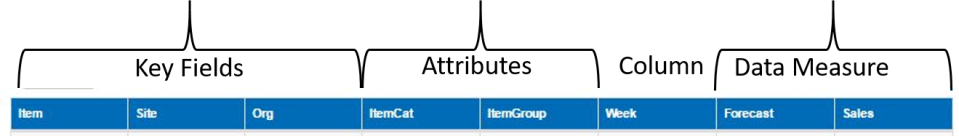
Case 2) The weeks are under a single column and each measure i.e Sales and Forecast are two different columns
To achieve this the following steps have to be followed
1) Create a Job task of type = BulkDataImport
2) Enter the following parameters for the task. These parameters help understand the data structure and what transform needs to be done
- Table: Enter the Data table name to which the csv file has to be imported. Ex: BMD_Article
- Keys: Enter the fields which are key in the data table. If there are multiple key fields use comma to separate them Ex: Item,Site,Org
- Column: Enter the column field in the data table. This is generally a time related field Ex: Week
- Measure: Enter the measure field name. Ex: Measure
- Data Measure: Enter the data measure fields from the data table that will store the quantity values. Ex: Sales,Forecast
- Attributes: Enter the fields which are attributes. Ex: ItemCategory, ItemGroup. Use comma to separate multiple fields
- Transform: For Importing data, the transform type has to be Pivot.
3) Upload the csv file when prompted during the task run
If the job task is scheduled, additional parameters are needed to specify the source file path. If the file is on the ftp server, then the ftp path and file name have to be specified.
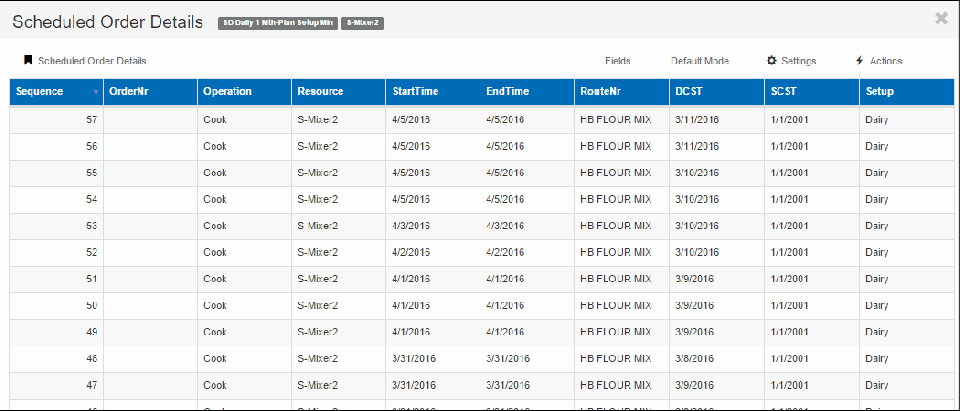
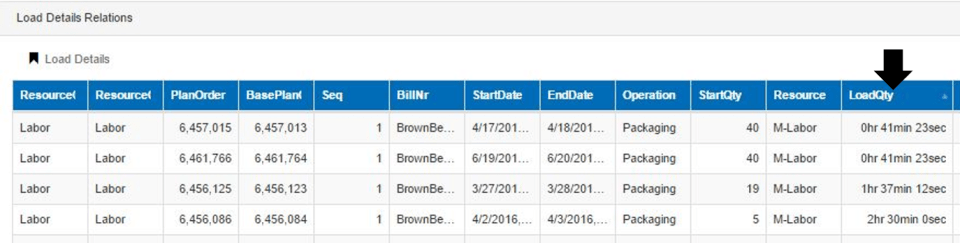
Once the task is complete, the imported data will appear as shown below in the data table

UnPivot & Export Data
Data in a Table can be exported into a csv file using the Bulk Export job. This data can be transformed using the pivot transform parameter to export the data in the required format.
The data in a table can be in two different formats .
Case 1) The weeks are under a single column along with measure with Quantity column displaying the respective values for each measure.
To Export this data follow these steps
1) Create a Job task of type = BulkDataExport
2) Enter the following parameters for the task. These parameters help understand the data structure and what transform needs to be done on the data during export
- Table: Enter the Data table name from which the csv file has to be exported. Ex: BMD_Article
- Keys: Enter the fields which are key for the data table. If there are multiple key fields use comma to separate them Ex: Item,Site,Org
- Column: Enter the column field for the data table. This is generally a time related field Ex: Week
- Measure: Enter the measure field name. Ex: Measure
- Data: Enter the data field in the data table that stores the quantity values. Ex: Quantity
- Attributes: Enter the fields which are attributes. Ex: ItemCategory, ItemGroup. Use comma to separate multiple fields
- Transform: For exporting data, the transform type has to be UnPivot.
If the job task is scheduled, additional parameters are needed to specify the destination file path. If the file is to be stored on the ftp server, then the ftp path and file name have to be specified.
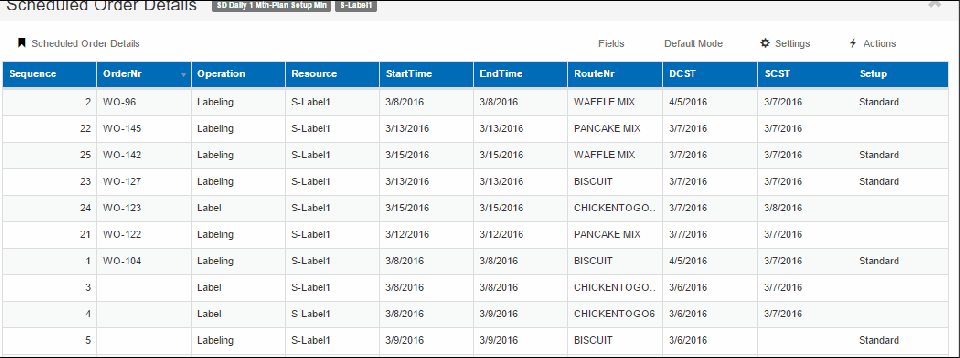
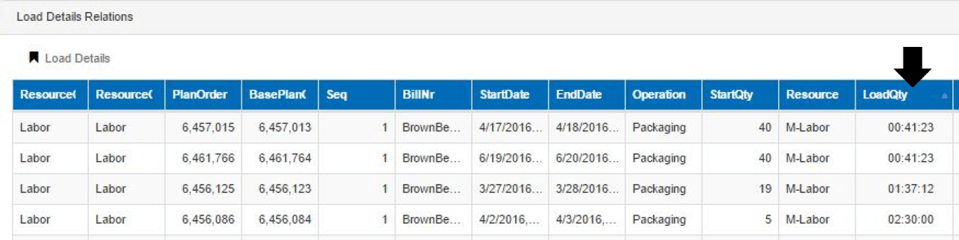
Once the task is complete, the exported data will appear as shown below in the sample csv file.
Case 2) The weeks are under a single column along with measure with Quantity column displaying the respective values for each measure.
To Export this data follow these steps
1) Create a Job task of type = BulkDataExport
2) Enter the following parameters for the task. These parameters help understand the data structure and what transform needs to be done
- Table: Enter the Data table name from which the csv file has to be exported. Ex: BMD_Article
- Keys: Enter the fields which are key for the data table. If there are multiple key fields use comma to separate them Ex: Item,Site,Org
- Column: Enter the column field in the data table. This is generally a time related field Ex: Week
- Measure: Enter the measure field name. Ex: Measure
- Data Measure: Enter the data measure fields in the data table that stores the data measure quantities. Ex: Sales,Forecast
- Attributes: Enter the fields which are attributes. Ex: ItemCategory, ItemGroup. Use comma to separate multiple fields
- Transform: For exporting data, the transform type has to be UnPivot.
If the job task is scheduled, additional parameters are needed to specify the destination file path. If the file is to be stored on the ftp server, then the ftp path and file name have to be specified.
Once the task is complete, the exported data will appear as shown below in the sample csv file.